My MXR 6 Band with VariPlex!

For all things to build the brown sound

Moderators: VelvetGeorge, RACKSYSTEMS

User avatar
Good Guest
Senior Member
Posts: 2030
Joined: Fri Nov 10, 2006 11:29 pm
Location: Canada

Re: My MXR 6 Band with VariPlex!

Post by Good Guest » Mon Jan 24, 2011 12:34 pm

Ahhhaa :mrgreen: Just as I suspect forumite guitarists showing signs of hearing loss in the lower frequencies..from too much feedback exposure.. :hide:


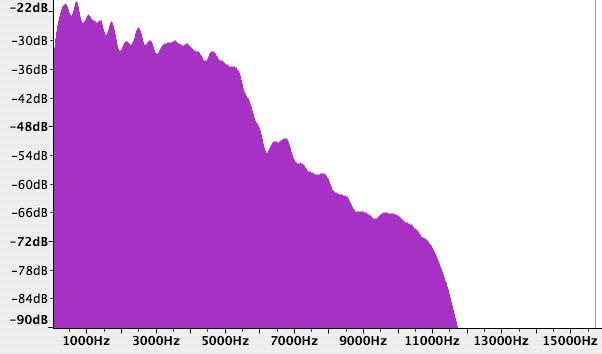
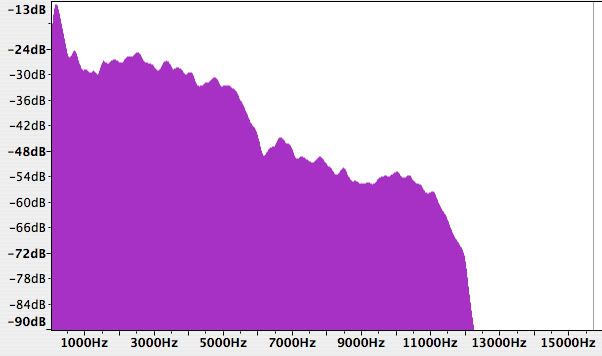
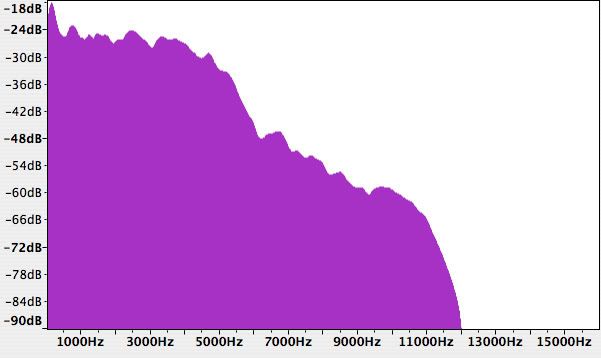
Anyways the spectrum analyzer isn't deaf... comparison of Motrock-Evh-strat78 ..same guitar parts ..evh from iso's

Note how evh doesn't lose the 600hz and note the 1.6khz boost inherent to the 6 band...
MotEvhStrat.jpg
MotEvhStrat.jpg (85.64 KiB) Viewed 1279 times

User avatar
vanhalen5150
Senior Member
Posts: 7307
Joined: Wed Sep 10, 2008 3:13 pm
Just the numbers in order: 7
Location: Halifax, Canada

Re: My MXR 6 Band with VariPlex!

Post by vanhalen5150 » Mon Jan 24, 2011 12:52 pm

If you set the test frequency so you can "just barely" hear it I'll bet there are a lot of guys who cant hear those lower frequencies. And if you can, I'll also bet you can still stay out all night partying with no hangover, run a 4/40 and bench press your own weight....... :wink:
12000 Metro Kit

User avatar
Tone Slinger
Senior Member
Posts: 6520
Joined: Thu Aug 24, 2006 10:31 am

Re: My MXR 6 Band with VariPlex!

Post by Tone Slinger » Mon Jan 24, 2011 1:40 pm

I kind of think of these sound graphs like I do about the guy who measures the speed of notes played by all the 'fast' guitarists, to see who actually plays faster. It's funny, because the faster SOUNDING guitarist, are sort of in the middle of this graph.

When you are looking at a graph, it disengages your ears, and makes you LOOK at sound, like, "Wow, I really like the way Eddie's guitar sound LOOKS". I could care LESS about a graph. I also think that it isnt accurate, meaning I think you could get several sound graphs togather that have slightly different signatures, yet SOUND totally different, based on the 'sound ' (which to me, cannot be made into a visual in ANY way).
Rip Ben Wise (StuntDouble) & Mark Abrahamian (Rockstah)

motrock
Senior Member
Posts: 1959
Joined: Mon Mar 17, 2008 6:06 pm

Re: My MXR 6 Band with VariPlex!

Post by motrock » Mon Jan 24, 2011 8:07 pm

Good Guest wrote:Ahhhaa :mrgreen: Just as I suspect forumite guitarists showing signs of hearing loss in the lower frequencies..from too much feedback exposure.. :hide:


Anyways the spectrum analyzer isn't deaf... comparison of Motrock-Evh-strat78 ..same guitar parts ..evh from iso's

Note how evh doesn't lose the 600hz and note the 1.6khz boost inherent to the 6 band...
MotEvhStrat.jpg
That is very interesting too see. Wow... hmm....

I need to add more in the 1.6 range. I am thinking that the speaker has a lot to do with the 600hz being lost.

leadguy
Senior Member
Posts: 2740
Joined: Thu May 10, 2007 10:37 am

Re: My MXR 6 Band with VariPlex!

Post by leadguy » Mon Jan 24, 2011 10:43 pm

For the Frequency Spectrum graphs to mean anything, the players have to have exactly the same note compared with no background instruments or whatever and the exact same part of the note compared.

The beginning attack of a note is very different to the note a few milliseconds after when the attack is decaying, and the frequencies in a Frequency Spectrum graph will vary accordingly with the attack and decay parts of a note.

That's why the hardest part about Frequency Spectrum comparison graphs is setting up the initial test conditions so they are the same for all participants as much as possible and even then there will be variations that have to be allowed for.

Even after all that, every player has their own attack when playing the same note so the Frequency Spectrum frequency graphs will vary according to each players initial attack of the note and it's not the same for different players.
A Robot device with computer precision attack would be needed to set the note in motion in the first place, in all of the comparisons so that the initial attack was consistent for all comparisons as much as possible.

When I was doing the Sinasl1 ATBL Frequency Spectrum comparison with Ed http://forum.metroamp.com/viewtopic.php ... 3&start=75" onclick="window.open(this.href);return false; it wasn't that bad because Sinasl1 was in sync with Ed, there was Sinasl1 in one channel and Ed in the other channel and the part of the particular ATBL note being compared was pretty similar in terms of attack and decay and pitch because Sinasl1 had played and put his track in sync with Ed's.
Sinasl1 still had a different note attack than Ed though and that's one of the reasons why Sinasl1 doesn't sound exactly like Ed in the first place.

btw I can't imagine Ed using a EQ on ATBL, mainly because Ed has 2 Echoplexes on it with 2 different delays (around 150ms and 300ms or something like that) that creates that distinctive opening riff timing. A EQ would just be in the way of the 2 Echoplexes IMO.
Usually Ed just uses 1 Echoplex but Ed has 2 Echoplexes on ATBL that enhance the opening riff.

Ed is yellow or channel 1 or the top graph and Sinasl1 is blue or channel 2 or the bottom graph.

Image

In other words, there will always be a part of how the harmonic frequencies will display themselves in a Frequency Spectrum graph, that is due to the player and their own note attack.
Tone in the hands.

The initial attack of the note is one of the initial causes of why players can sound different playing the same gear.

Get a Saxophone or a Violin and just for the same one note, hand it to a beginner and then hand it to a professional and it will not sound the same even though it's the same Saxophone or Violin being played by both the beginner and professional and the difference is mostly in the initial attack of the note by the beginner or professional and id a Frequency Spectrum comparison was done on the beginner and professional players same instrument, same note and same part of the note, then the differences would show up in the Frequency spectrum graph and these differences would be due mostly to the differences of the initial attack of the note.
"When your swinging, Swing some MORE" ~Monk

User avatar
Good Guest
Senior Member
Posts: 2030
Joined: Fri Nov 10, 2006 11:29 pm
Location: Canada

Re: My MXR 6 Band with VariPlex!

Post by Good Guest » Tue Jan 25, 2011 12:27 am

That's what is so good about the iso clips.....for the first time in history guitarists have the unadultrated guitar licks without the drums and cymbals and vocal bleed mucking up the spectrum. :thumbsup: Now single notes can be picked apart and compared and analyzed for more accuracy than ever before.....while not perfect because of dual mics and room acoustics , it is still way better than cluttered instruements and is pretty well what is available to the public. :D

Regarding past spectrums done on ATBL and other tunes ...the spectrums had to be very wide to even get some semblance of frequency analysis...almost pointless because all they really showed was the speaker rolling off at 5khz..woppee ding.... :stars: and high frequency artifacts that fall out of most peoples hearing range. :listen:

Because we do know what tools EVH used to get his tone ..it is feasable to say when looking at spectrum of a piece and noticing a sharp 9db boost at 1.6 khz and assume it was probably his mxr 6 band .. :whistle: not knowing the tools used you would not even be able to speculate...same with a dip at 600hz .....a natural frequency response for a 4X12 marshall cab...which also is derived by spectrum analysis and the same with a speakers frequency response..another graph...so try and look at the guitar iso's as the frequency response specs of a certain segment of time , containing frequency information...if it wasn't there it wouldn't show up...simple as that. :rock:

leadguy
Senior Member
Posts: 2740
Joined: Thu May 10, 2007 10:37 am

Re: My MXR 6 Band with VariPlex!

Post by leadguy » Tue Jan 25, 2011 12:39 am

To show any consistent boost of certain frequencies would require a sampling of say 80 Frequency Spectrum analysis graphs from different points in one of Ed's iso tracks and even if some consistently boosted frequencies were then found, it could just be due to Ted or something else.
"When your swinging, Swing some MORE" ~Monk

User avatar
wjamflan
Senior Member
Posts: 941
Joined: Sat Feb 21, 2009 9:06 am
Just the numbers in order: 7

Re: My MXR 6 Band with VariPlex!

Post by wjamflan » Tue Jan 25, 2011 10:27 am

btw I can't imagine Ed using a EQ on ATBL, mainly because Ed has 2 Echoplexes on it with 2 different delays (around 150ms and 300ms or something like that) that creates that distinctive opening riff timing. A EQ would just be in the way of the 2 Echoplexes IMO.
This is your opinion for sure.

I've used 2 eqs with with 2 delays at the same time with no problem whatsoever. It can be done, and my opinion is that Ed was using an eq on ATBL too.

FWIW, using an MXR 6-band on ATBL provides that little extra for the flanger sweeps to sound like they should - big, fat, and raunchy. Try it, and it just might surprise you.

User avatar
Good Guest
Senior Member
Posts: 2030
Joined: Fri Nov 10, 2006 11:29 pm
Location: Canada

Re: My MXR 6 Band with VariPlex!

Post by Good Guest » Tue Jan 25, 2011 3:53 pm

leadguy wrote:To show any consistent boost of certain frequencies would require a sampling of say 80 Frequency Spectrum analysis graphs from different points in one of Ed's iso tracks and even if some consistently boosted frequencies were then found, it could just be due to Ted or something else.

Unfortunalely there isn't 80 room mic positions to please you...there is just what is out there and that's it..Guitarists will have to make do with what is out there...and they will ..and the modelling companies and now the spectrum modelling companies also...so get used it. No use crying and pouting over it.. :cry:

Here there is a good link full of myths and stuff about audio that should keep you happy.. :popcorn:

http://www.ethanwiner.com/articles.html" onclick="window.open(this.href);return false;

motrock
Senior Member
Posts: 1959
Joined: Mon Mar 17, 2008 6:06 pm

Re: My MXR 6 Band with VariPlex!

Post by motrock » Tue Jan 25, 2011 8:04 pm

So, back to my original question... what do I need to do to get that chewiness that I am not hearing? Rockstah, Ralle, and I are all using the same speakers.. and I am thinking that the 6402 cones might be the issue. What can you guys tell me about the difference in frequencies between the 1777 cones and 6402 cones?

leadguy
Senior Member
Posts: 2740
Joined: Thu May 10, 2007 10:37 am

Re: My MXR 6 Band with VariPlex!

Post by leadguy » Tue Jan 25, 2011 11:28 pm

80 room mic positions to please you
I didn't mean 80 different mic positions, I meant sampling at 80 different places within one of Ed's iso tracks.

Why?

Because sampling at say 80 different places would include a wider variety of notes and their harmonics and therefore give a more consistent idea of what frequencies might be boosted or cut.

The more samples that are frequency analyzed, the more accurate the overall frequency patterns will be, including any overall boosts or cuts.

Just one or two frequency analysis graphs done per song is basically too inaccurate.

Where you are looking for a 1.2khz boost or a 1.6khz boost or whatever, these frequency areas also include a lot of other note and their harmonics information as well, so if a 1.2kz peak shows up in 5 sampled points and not much in the other 75 sampled points then the 1.2kz peak would probably have to be considered not really part of a overall boost for example.

If a 1.2khz peak showed up in the majority of the 80 sampled points, then it would probably have to be considered a part of some overall boost but pinpointing what is responsible for it is another thing altogether.
"When your swinging, Swing some MORE" ~Monk

leadguy
Senior Member
Posts: 2740
Joined: Thu May 10, 2007 10:37 am

Re: My MXR 6 Band with VariPlex!

Post by leadguy » Wed Jan 26, 2011 3:12 am

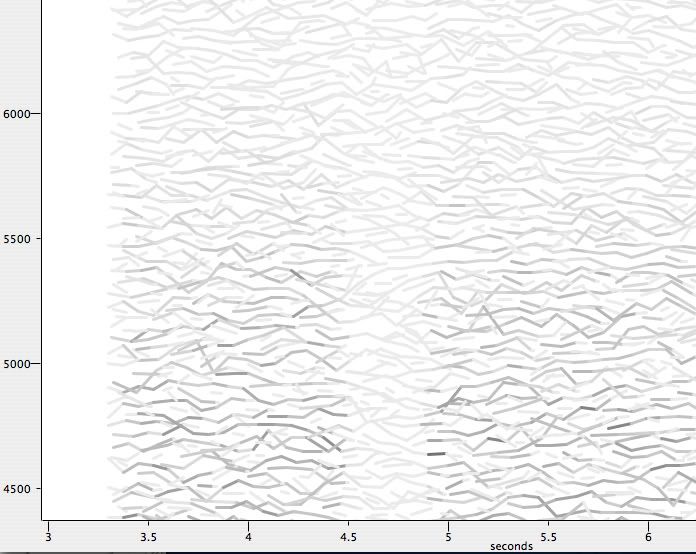
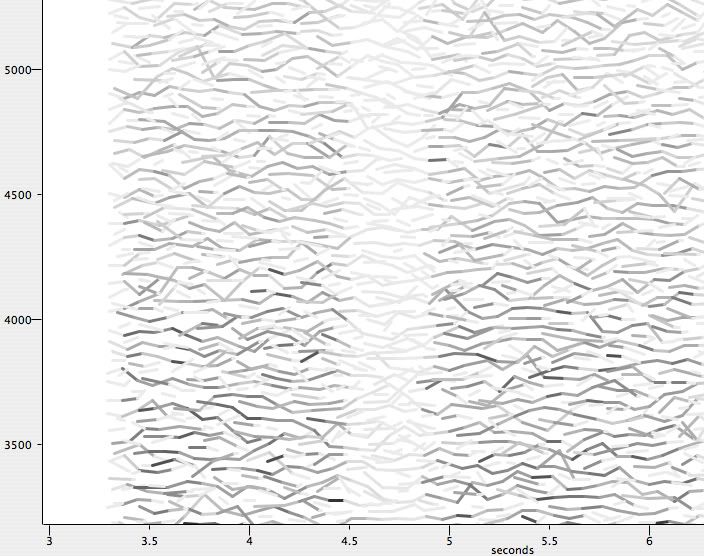
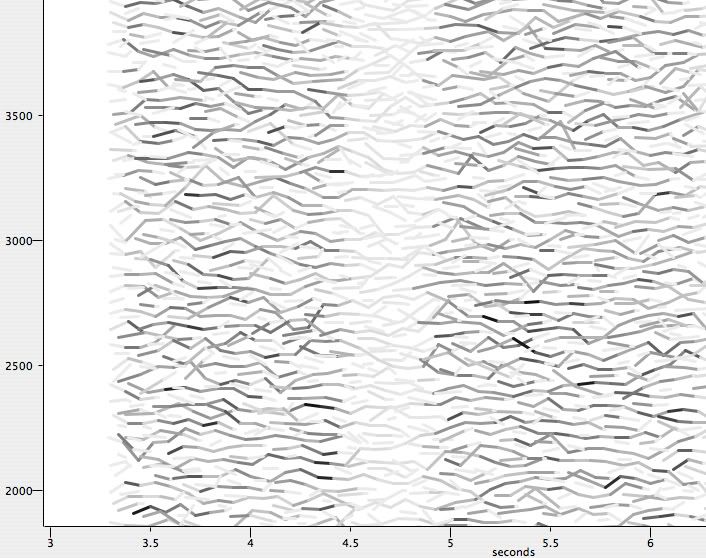
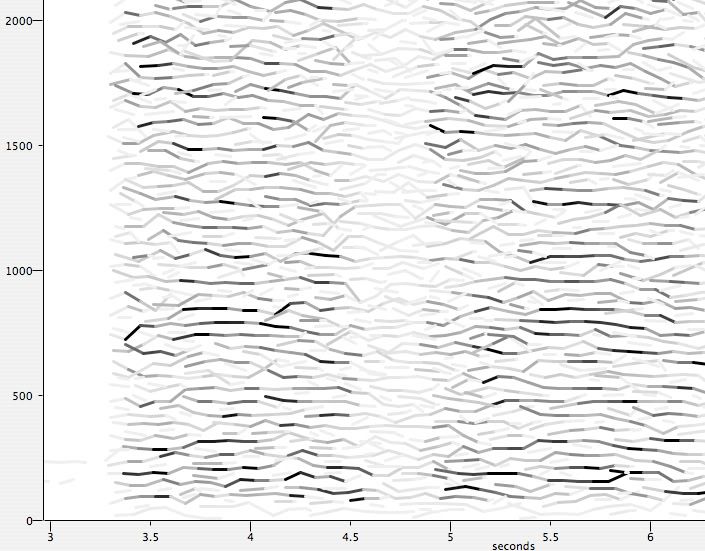
Here is the first 6 seconds of the YRGM iso sampled by Frequency Analysis.

It shows how the frequency strength is varying over time (6 seconds in this case).

I can only fit 6 seconds into the images for this forum and I really can't be bothered doing much more because it's all pretty meaningless to me.

The frequency strength is denoted by how dark the line is.

The frequencies are up the side of the image and the time is along the bottom of the image.

Looking at the graphs and comparing how dark the line is at a certain time will show how the different frequency strengths are varying over time.
A darker line at that point meeans more frequency strength.


Make of it what you will.

Notice the decrease in frequency strength around the 5 kHz mark (lines get very grey).

That would most likely be a Celestion speaker cutoff.

Image

Image

Image

Image
"When your swinging, Swing some MORE" ~Monk

leadguy
Senior Member
Posts: 2740
Joined: Thu May 10, 2007 10:37 am

Re: My MXR 6 Band with VariPlex!

Post by leadguy » Wed Jan 26, 2011 8:11 am

The first 30 seconds of Ed's RWTD iso Frequency Analysis

Don't forget, these frequency peaks are mostly due to the note frequencies that are mostly being played and their harmonics and isolating the tonestack settings or trying to isolate if a MXR EQ is being used or trying to isolate anything that has a filter effect is not that easy except for the speaker cutoff which is pretty obvious and affects all frequencies above 5KHz.

The main strongest frequency peaks in the first 30 seconds are

387 Hz

715 Hz

1054 Hz

1406 Hz

1726 Hz

2158 Hz

2507 Hz

etc

Once again there is a sharp 5kHz cutoff pointing to Ed's Celestion being the cause.

The MXR EQ bands boost 100 Hz, 200Hz, 400Hz, 800Hz, 1600Hz, 3200Hz.

Image
Last edited by leadguy on Wed Jan 26, 2011 10:12 am, edited 2 times in total.
"When your swinging, Swing some MORE" ~Monk

leadguy
Senior Member
Posts: 2740
Joined: Thu May 10, 2007 10:37 am

Re: My MXR 6 Band with VariPlex!

Post by leadguy » Wed Jan 26, 2011 8:26 am

The first 30 seconds of Ed's ATBL iso Frequency Analysis

The main strongest frequency peaks in the first 30 seconds are

184 Hz

713 Hz

1558 Hz

1869 Hz

2254 Hz

2528 Hz

etc

Image
Last edited by leadguy on Wed Jan 26, 2011 8:38 am, edited 1 time in total.
"When your swinging, Swing some MORE" ~Monk

leadguy
Senior Member
Posts: 2740
Joined: Thu May 10, 2007 10:37 am

Re: My MXR 6 Band with VariPlex!

Post by leadguy » Wed Jan 26, 2011 8:37 am

The first 30 seconds of Ed's YRGM iso Frequency Analysis

The main strongest frequency peaks in the first 30 seconds are


167 Hz

771 Hz

1245 Hz

1488 Hz

1719 Hz

2492 Hz

etc

Image
"When your swinging, Swing some MORE" ~Monk

Post Reply